Workspace
The creation of a customized workspace allows the user to display the desired information to monitor the operation.
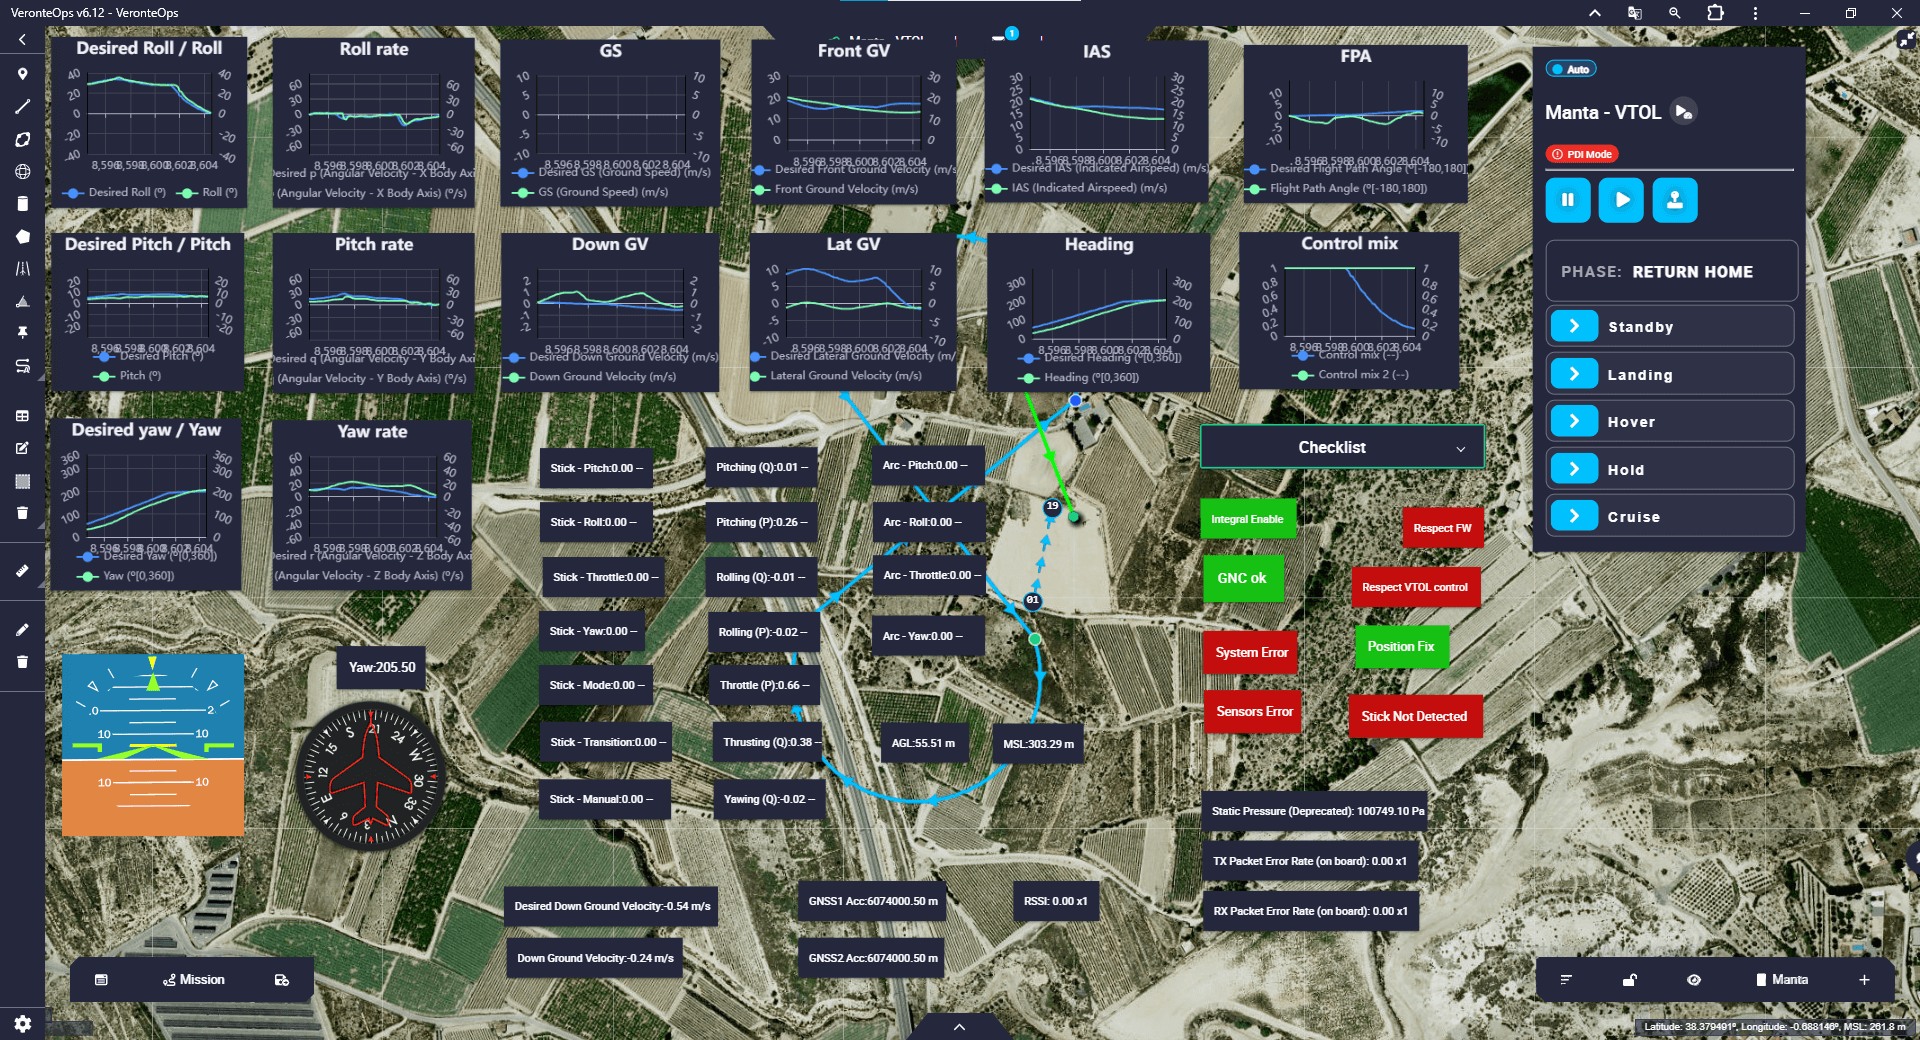
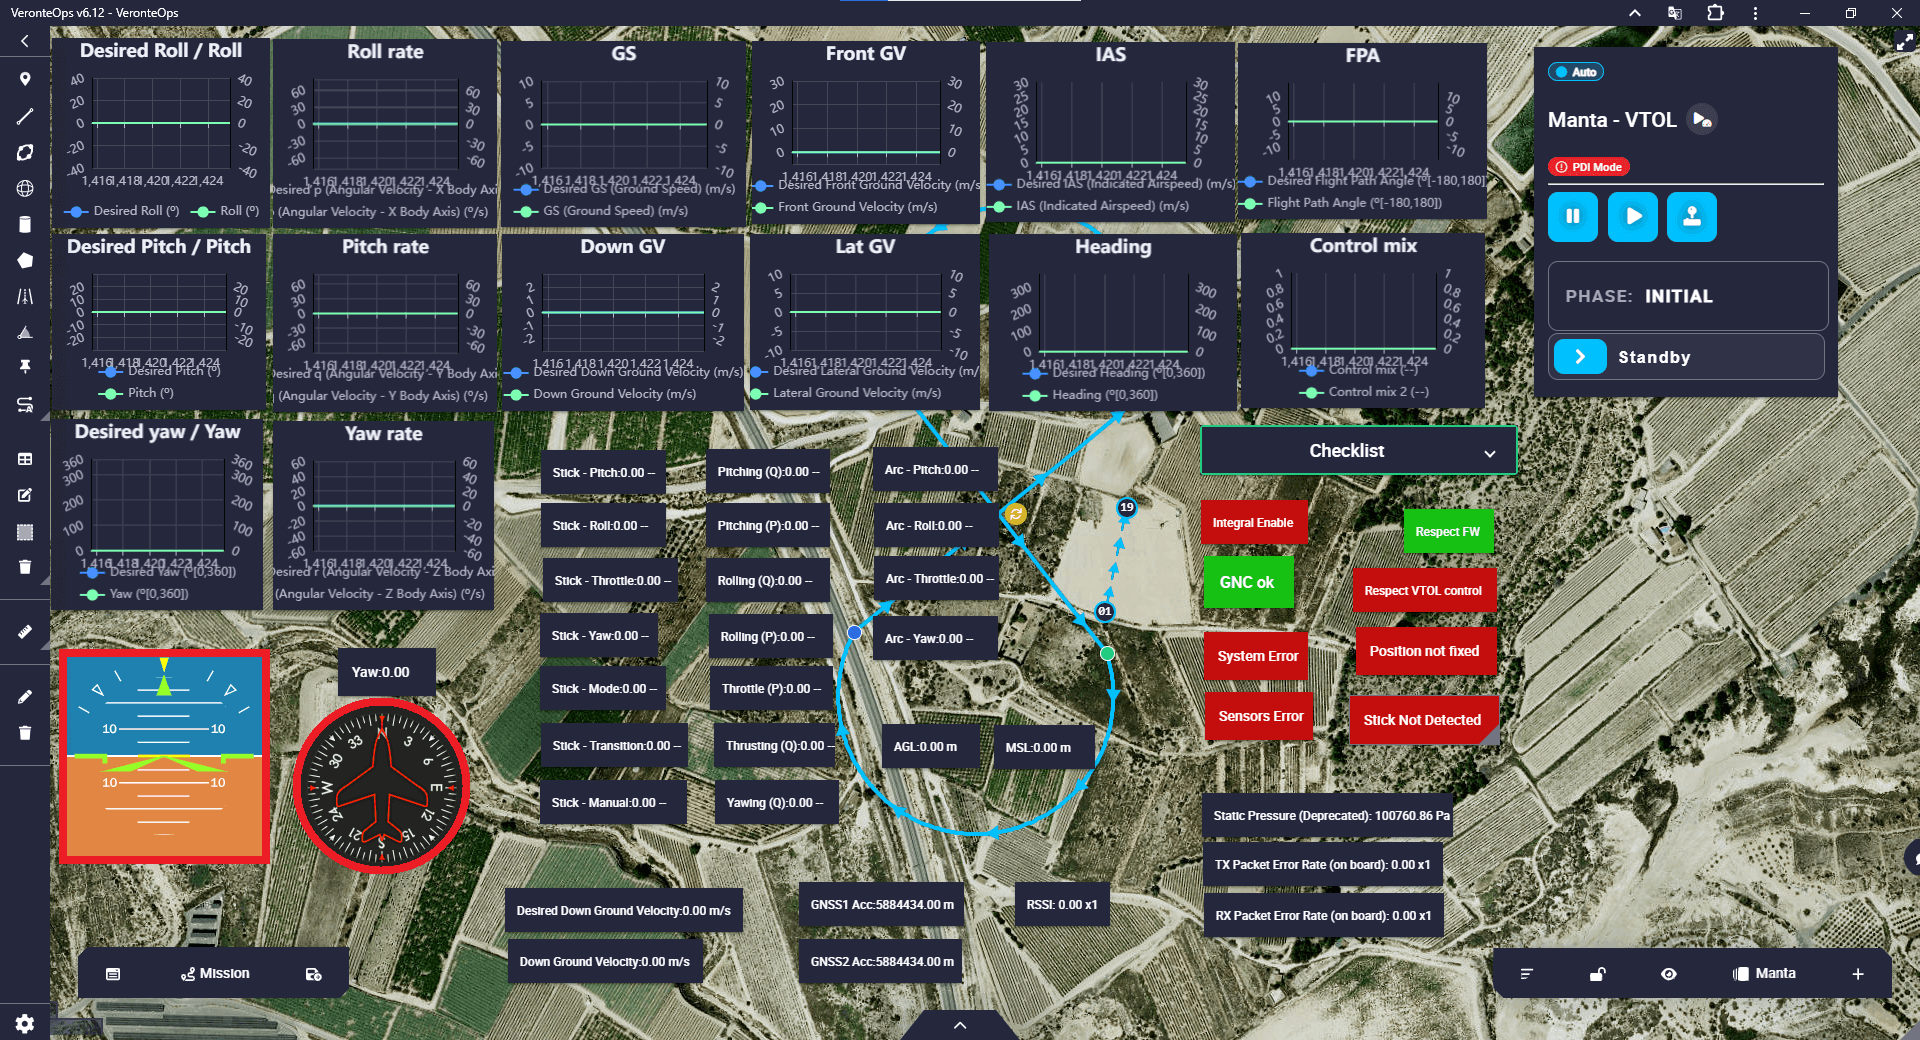
Workspace example
For more information, visit the Workspace - Panels section of the Veronte Ops user manual.
This section explains the main settings and widgets that are recommended be incorporated in the workspace to perform a basic flight.
Note
This workspace is designed specifically for the operation being performed, so not all the widgets explained below are necessarily useful for all operations.
Important
The widgets explained are not mandatory, each user should configure the workspace by adding the widgets that provide the best information about the operation.
Map
Veronte Ops offers the possibility to choose the map on which users want to operate. Users can choose from the maps provided by Veronte Ops or upload their own map.
In this operation, the ESRI Satellite map has been employed.
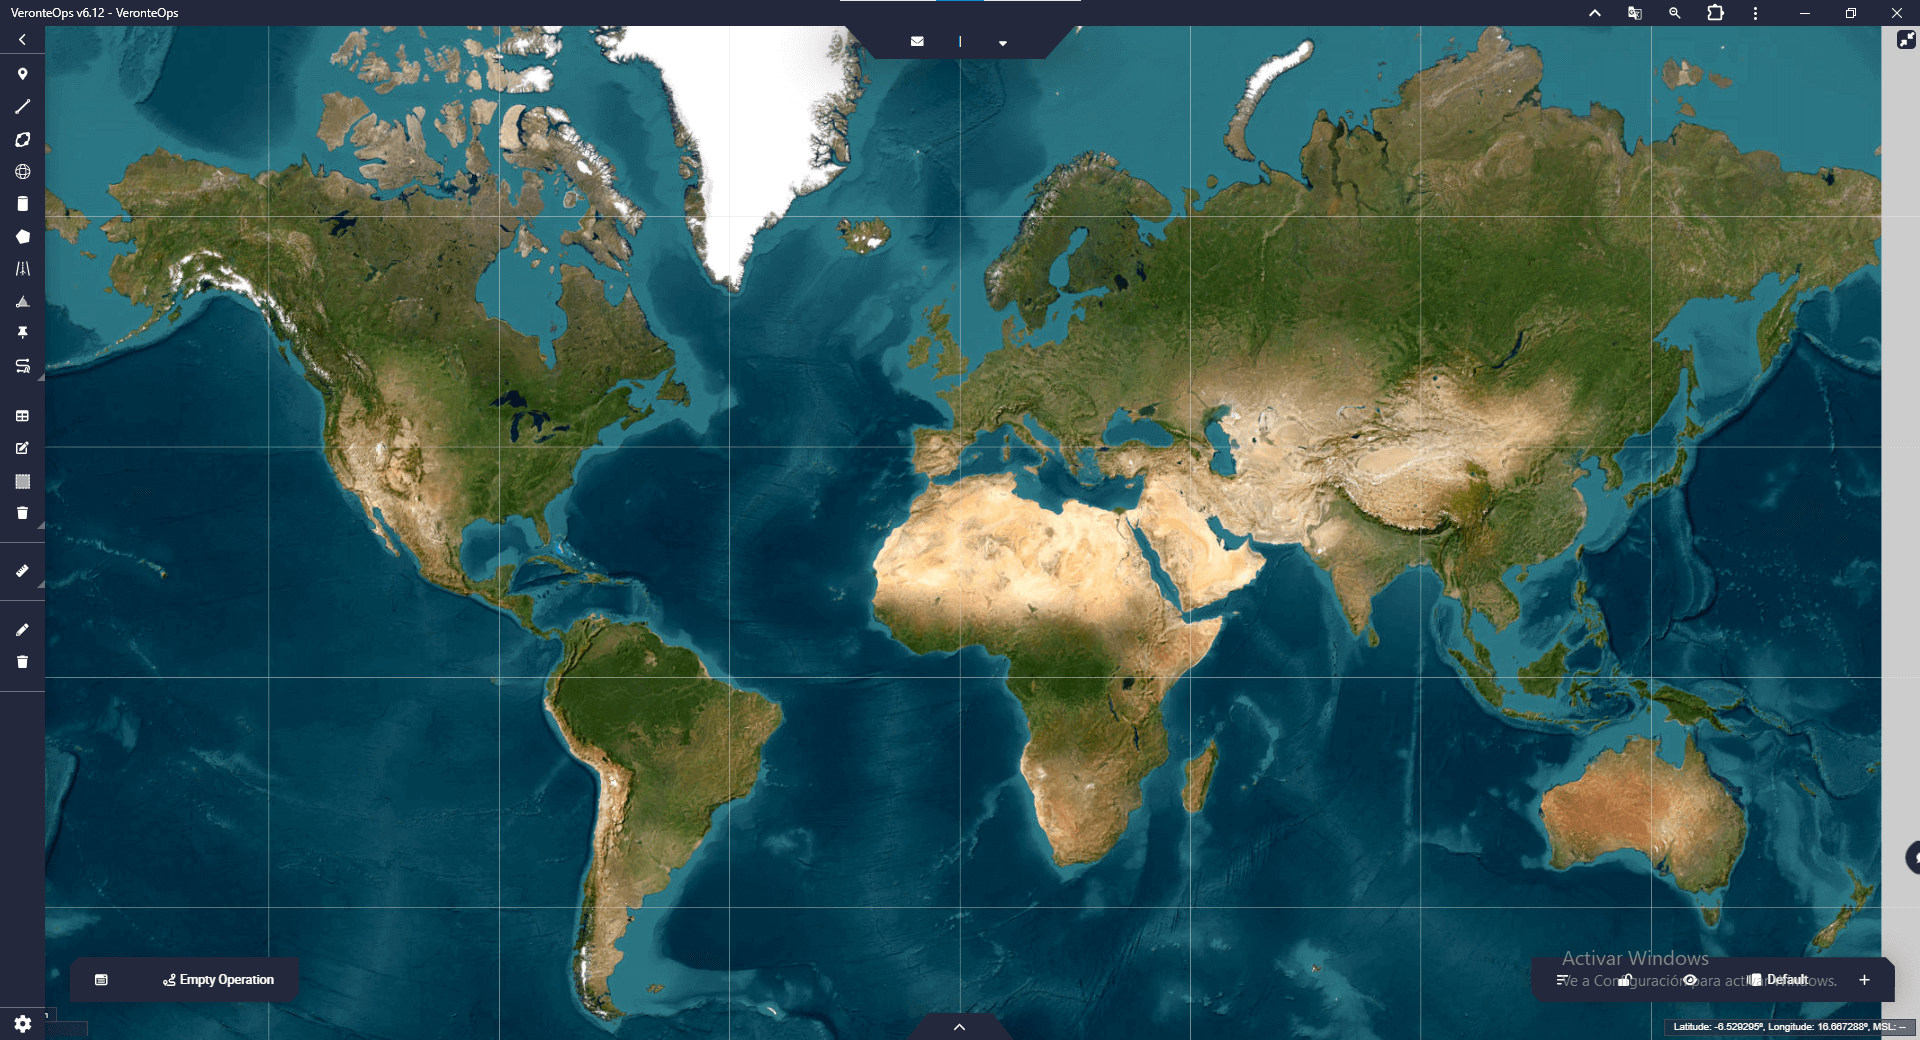
Workspace - Map
For more information, visit the Map option - Workspace section of the Veronte Ops user manual.
Main
Widgets from the “Main” category that have been used are presented below. For more information on these widgets, visit the Main - Widgets section of the Veronte Ops user manual.
Veronte Panel. This pannel is the basic operator tool. It includes all basic commands (phase and action buttons) and information needed during a standard mission. These commands can be triggered with a single click, by sliding and/or automatically.
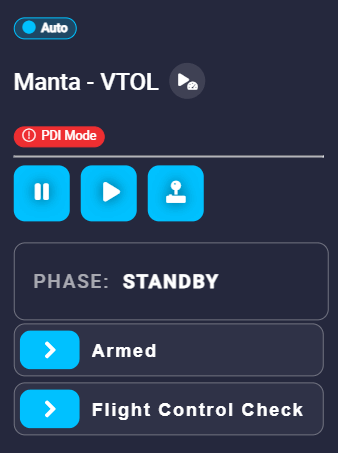
Workspace - Veronte Panel
Important
PDI Mode: This only appers if PDI Mode is configured in the 1x PDI Builder app.
Checklist. This panel is used to make sure that some requirements have been met. This represents the checklist explained in Checklist - 1x PDI Builder configuration section.
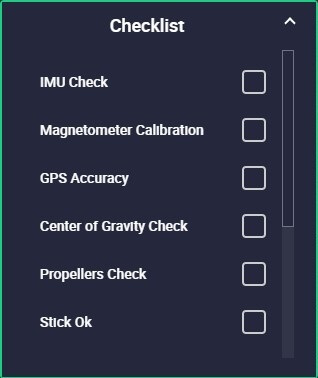
Workspace - Checklist
Important
It must be previously defined in the Checklist panel of the Safety menu of the 1x PDI Builder app.
Displays
These widgets allow the user to display in real time the value of a variable.
For more information, visit the Displays - Widgets section of the Veronte Ops user manual.
Label. With labels the user can display the value of an Integer variable, Real variable or Bit variable. For a basic flight, the following labels are recommended:
Variable
Label
Type
GNSS1 Accuracy
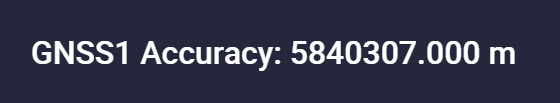
Real variable
GNSS2 Accuracy
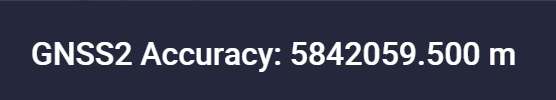
Real variable
AGL
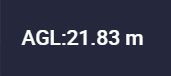
Real variable
MSL
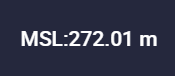
Real variable
Position Fix

Bit variable
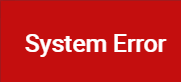
System Error
Bit variable
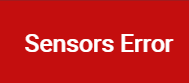
Sensors Error
Bit variable
Stick not detected

Bit variable
It may also be interesting to display other variables in the labels:
Stick-Pitch, Stick-Roll, Stick-Throttle, etc.
Arc-Pitch, Arc-Roll, Arc-Throttle, Arc-Yaw
Pitching (Q), Pitching (P), Rolling (Q), Rolling (P), etc
Down Ground Velocity
Static Pressure
PDI error
Power input
Charts
For more information, visit the Charts - Widgets section of the Veronte Ops user manual.
Chart. Charts widgets allow the user to represent any variable of the system with respect to time. Thus, the user can visualize the evolution of that variable over time.
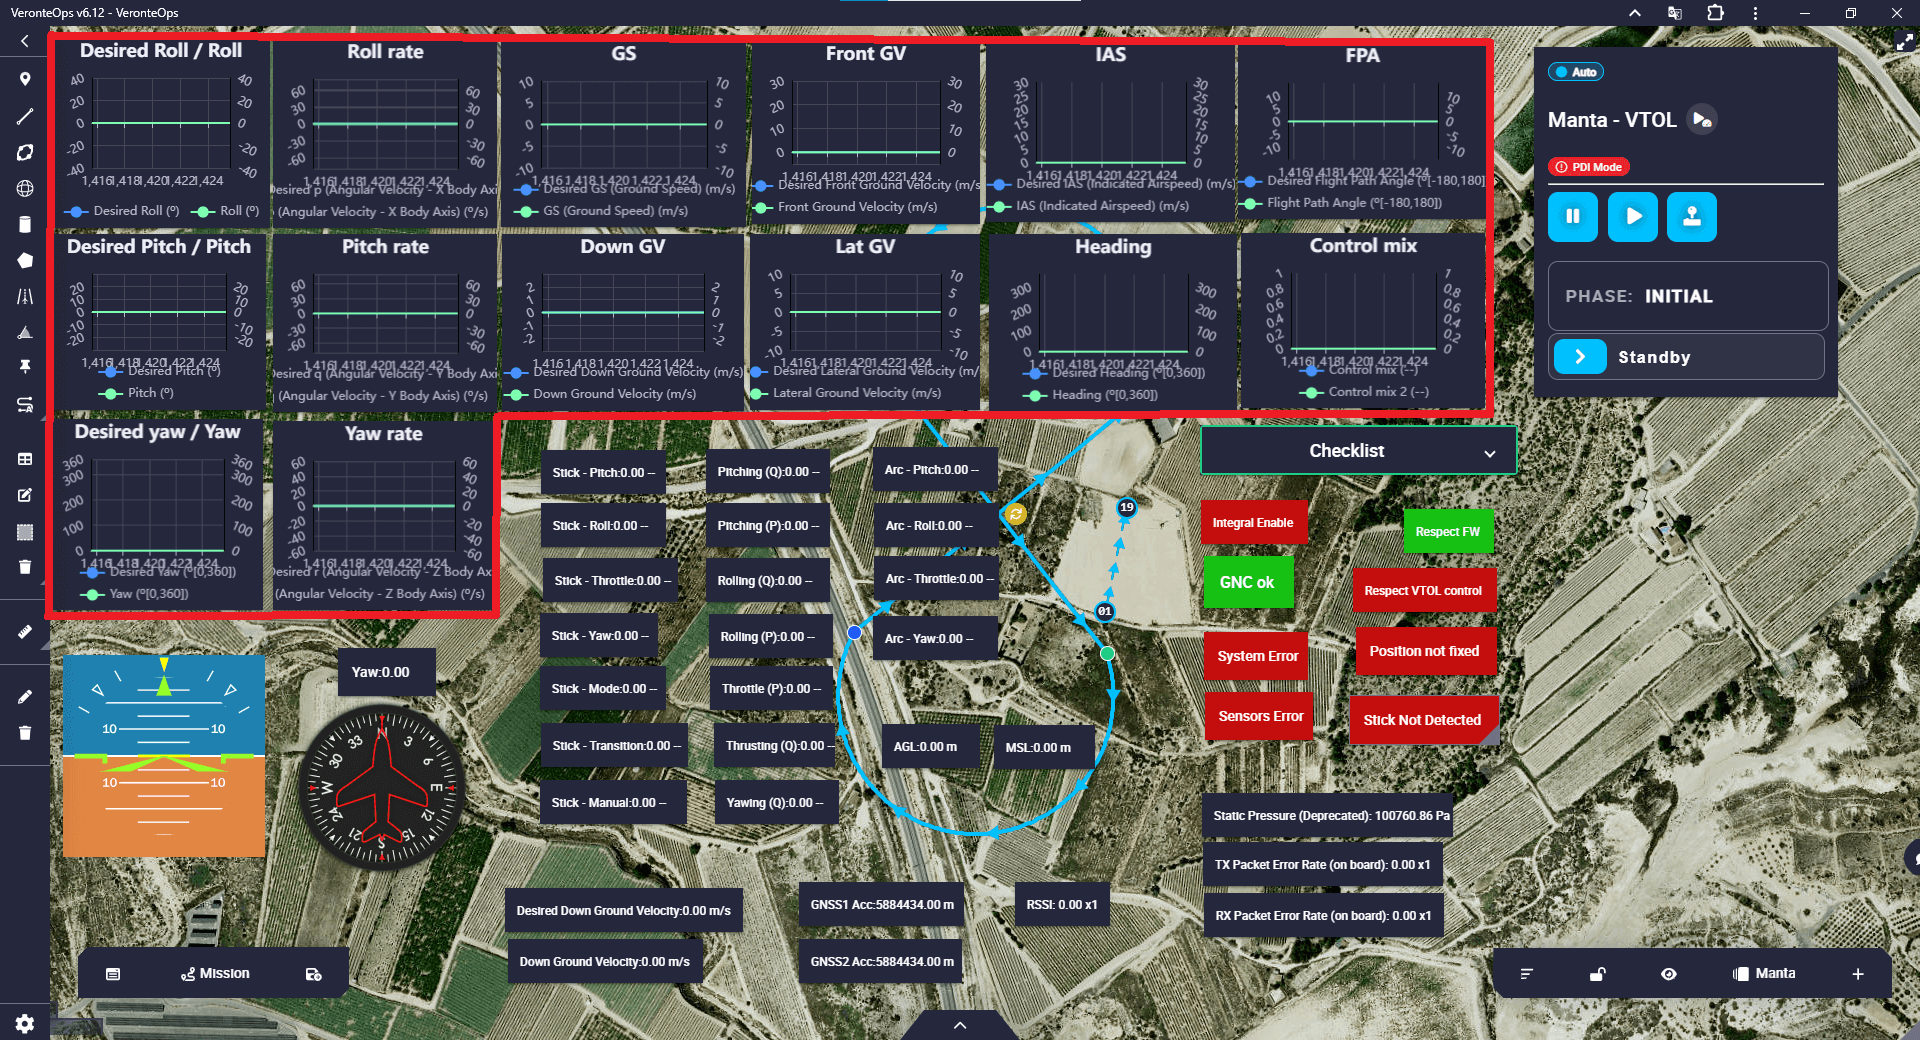
Workspace - Charts
For a basic flight, the following variables are recommended for charts:
Variable 1

Variable 2

Desired Roll
Roll
Desired Pitch
Pitch
Desired Roll
Yaw
Desired Ground Speed (GS)
Ground Speed (GS)
Desired Front GV
Front GV
Desired Down GV
Down GV
Desired Lateral GV
Lateral GV
Desired Heading
Heading
Desired IAS
IAS
Desired FPA
Flight Path Angle (FPA)
It may also be interesting to plot the following variables:
Control mix
Roll rate, Pitch rate, Yaw rate
P, Q, R (Angular Velocity)
Gauge. Gauge widget is a data visualisation tool that can be used to show the progress of data or display data in ranges in a precise and compact area.
This widget can also be useful to represent variables such as IAS or Motor RPM:
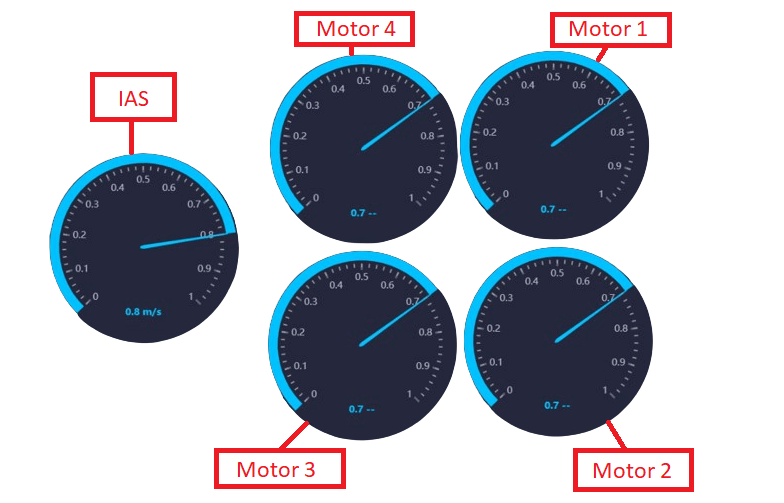
Workspace - Gauge
Flight instruments
Workspace - Flight instruments
For more information, visit the Flight instruments - Widgets section of the Veronte Ops user manual.
Attitude. The attitude widget, commonly known as Primary Flight Display (PFD) or ‘artificial horizon’, represents graphically the attitude of the aircraft (roll and pitch).
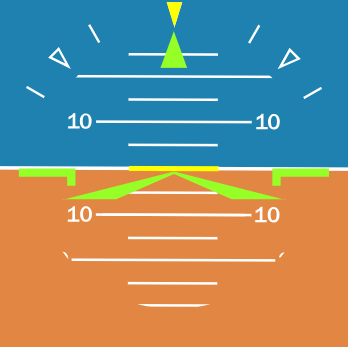
Workspace - Attitude
Heading. The heading widget, commonly known as compass, usually shows the platform’s yaw relative to the magnetic north.
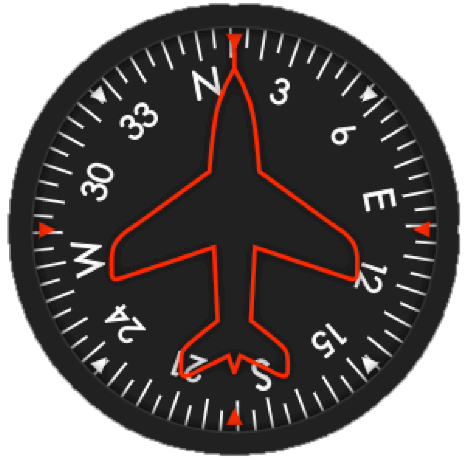
Workspace - Heading